report
Indian Commercial Aquafeed Market Outlook 2020
Indian Commercial Aquafeed Market Outlook 2020
author
RNCOS
published
Apr. 22, 2016
Discounts are available for multiple report purchases. Contact us for details.
For more information: reports@undercurrentnews.com
Indian Commercial Aquafeed Market Outlook 2020
author
RNCOS
published
Apr. 22, 2016
For multi-user licenses contact us
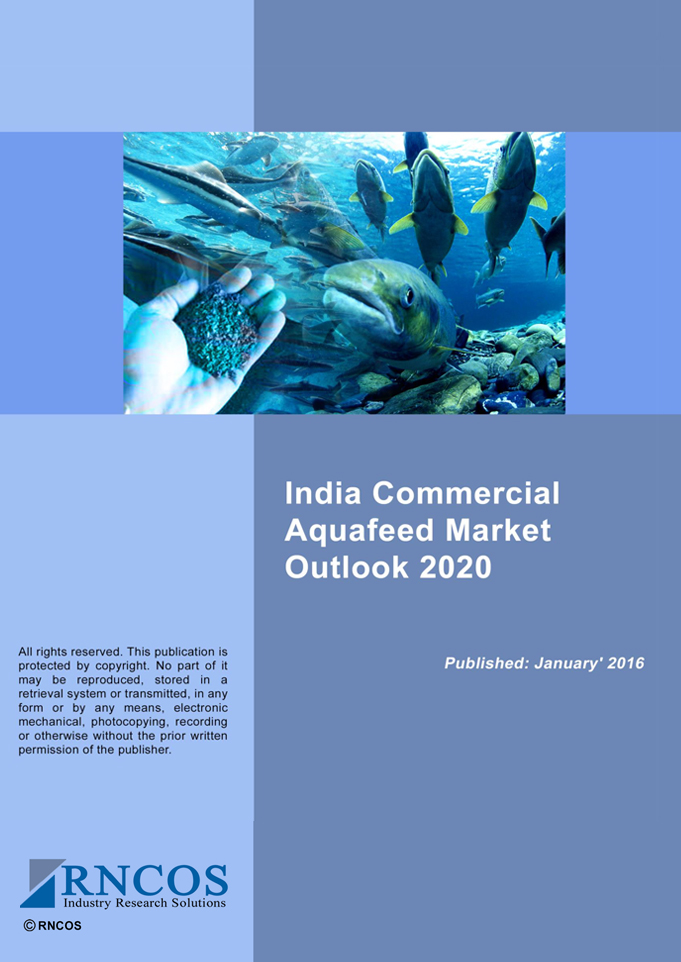
The Indian subcontinent's rise as an important aquaculture producer presents an immense opportunity for aquafeed manufacturers. Farmers' shift from traditional feeding techniques to commercial methods, along with government schemes and subsidies to promote aquaculture, are helping to boost this growth. Published in January 2016, this 63-page-long report provides in-depth study of India's aquaculture industry's performance in inland and marine aquaculture production, along with the demand of commercial aquafeed industry in the coming years. The research is the outcome of extensive primary & secondary research, for which the authors analyzed industry expert insights from fisheries, aquafeed manufacturers and aquafeed suppliers. For the major farmed finfish species like carps, tilapia and catfishes, along with farmed shellfish, the report provides production forecasts till 2020. Due to an increase in aquaculture cultivation, the demand for production and consumption of aquafeed is expected to increase. The report also includes:
- Aquaculture feed market forecast up to 2020, along with the production and consumption of aquafeed by finfish and shrimp fish.
- Drivers and challenges, & regional aquafeed demand, broken up for finfish and shrimp
- A business overview of key industry players
- A section on the major ingredients used in commercial finfish feed, to understand and evaluate the kind of ingredients that will be in demand with the increase in aquaculture production
- Description of government initiatives for promoting aquaculture production, along with key drivers and industry restraints of the commercial aquafeed market as well as technological advancements in aquaculture industry
- A comprehensive outlook of the sector’s present and future scenario
Overall, the report is a result of extensive research and prudent analysis that will be offering suitable knowledge base to those who are interested in this industry.
Click here to view a sample with a full table of contents.
Table of Contents
- Analyst View
- Research Methodology
- Aquaculture Production Scenario 3.1 Finfish 3.1.1 Carps 3.1.2 Catfish 3.1.3 Tilapia 3.2 Shellfish
- Commercial Aquafeed Market Outlook to 2020 4.1 Finfish 4.1.1 Market Overview 4.1.2 Regional Demand 4.1.3 Production 4.1.3.1 Carps 4.1.3.2 Catfish 4.1.3.3 Tilapia 4.1.4 Consumption 4.1.4.1 Carps 4.1.4.2 Catfish 4.1.4.3 Tilapia 4.2 Shrimp 4.2.1 Market Overview 4.2.2 Regional Demand
- Commercial Finfish Feed by Ingredients
- Feed Conversion Ratio by Type of Finfish
- Market Drivers 7.1 Government Initiatives Accelerating the Aquaculture Industry 7.2 Rising Aquaculture Production driving Aquafeed Demand 7.3 Increasing Awareness Boosting the Commercial Feed Market 7.4 Aquaculture Industry witnessing significant growth due to FDI
- Technological Advancements in Aquaculture 8.1 Nanotechnology in the Aquaculture Industry 8.2 Aeration Technology for Better Cultivation of Aquaculture
- Industry Restraints
- Government Initiatives
- Competitive Landscape 11.1 Indian Broiler Group 11.2 Growel Feeds Private Limited 11.3 Uno Feeds 11.4 Kwality Feeds Ltd 11.5 Deepak Nexgen Feed Pvt. Ltd 11.6 Grobest Feeds Corporation India Ltd 11.7 C.P. Aquaculture India Pvt. Ltd 11.8 Mulpuri Foods and Feeds Pvt. Ltd. 11.9 Avanti Feeds Ltd. 11.10 Godrej Agrovet Ltd. 11.11 The Waterbase Ltd 11.12 Nexus Feeds Ltd
List of Figures:
Figure 3-1: Aquaculture Production (Million Tonnes), 2014-2020 Figure 3-2: Share of Aquaculture Production by Fisheries Type, (2015) Figure 3-3: Inland Aquaculture Fish Production (Million Tonnes), 2014-2020 Figure 3-4: Share of Inland Aquaculture Production by Fish Type (2015 & 2020) Figure 3-5: Marine Aquaculture Fish Production (Million Tonnes), 2014-2020 Figure 3-6: Share of Marine Aquaculture Production by Fish Type, (2015 & 2020) Figure 3-7: Aquaculture Finfish Production (Million Tonnes), 2014-2020 Figure 3-8: Aquaculture Carps Production (000 Tonnes), 2015, 2018 & 2020 Figure 3-9: Aquaculture Catfish Production (000 Tonnes), 2015, 2018 & 2020 Figure 3-10: Aquaculture Tilapia Production (000 Tonnes), 2015, 2018 & 2020 Figure 3-11: Aquaculture Shellfish Production (Million Tonnes), 2014-2020 Figure 4-1: Commercial Aquafeed Market (Million INR), 2014-2020 Figure 4-2: Commercial Aquafeed Market by Type (%), 2015 & 2020 Figure 4-3: Commercial Finfish Feed Market (Million INR), 2014-2020 Figure 4-4: Commercial Finfish Feed Demand by Region (%), 2015 Figure 4-5: Commercial Finfish Feed Production (Million Tonnes), 2014-2020 Figure 4-6: Commercial Carps Feed Production (000 Tonnes), 2015, 2018 & 2020 Figure 4-7: Commercial Catfish Feed Production (000 Tonnes), 2015, 2018 & 2020 Figure 4-8: Commercial Tilapia Feed Production (000 Tonnes), 2015, 2018 & 2020 Figure 4-9: Commercial Finfish Feed Consumption (Million Tonnes), 2014-2020 Figure 4-10: Commercial Carps Feed Consumption (000 Tonnes), 2015, 2018 & 2020 Figure 4-11: Commercial Catfish Feed Consumption (000 Tonnes), 2015, 2018 & 2020 Figure 4-12: Commercial Tilapia Feed Consumption (000 Tonnes), 2015, 2018 & 2020 Figure 4-13: Commercial Shrimp Feed Market (Million INR), 2014-2020 Figure 4-14: Commercial Shrimp Feed Demand by Region (%), 2015 Figure 9-1: Major Challenges of Aquaculture Industry


